

How to Use Data to Improve Your School Newsletter
A school sends 30 newsletters a year. After three years, they have 90 data points on what their parent community opens, clicks, and ignores. Most schools do not use any of it. They write the next newsletter the same way they wrote the last one, with no reference to what worked. Using your newsletter data does not require a statistics degree. It requires 10 minutes every month and a willingness to change one thing at a time.
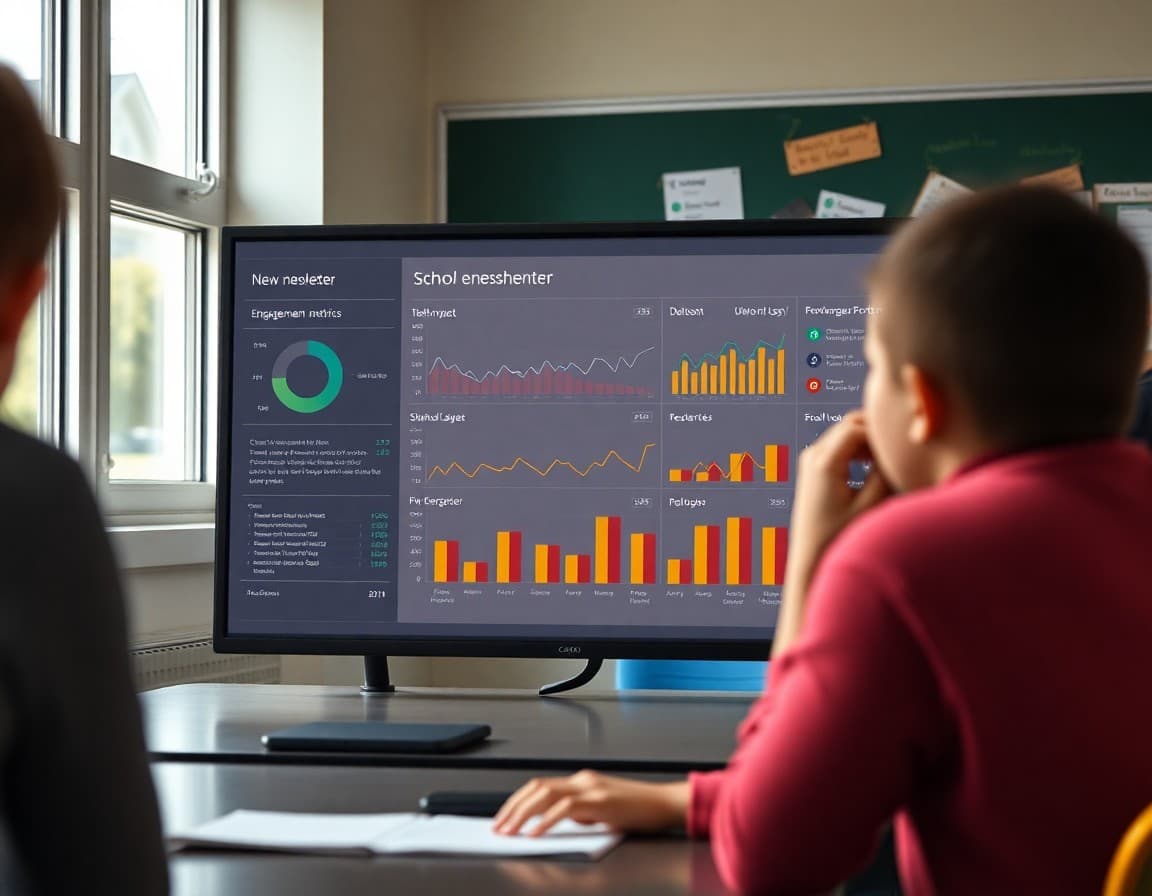
The Three Metrics That Matter
Start with three numbers: open rate, click rate, and unsubscribe rate. Open rate tells you whether the subject line and send time are working. Click rate tells you whether the call to action is clear and compelling. Unsubscribe rate tells you whether the content or frequency is pushing families away. These three metrics together cover the main ways newsletters succeed or fail, and they are available in any modern newsletter platform.
Reading Trends, Not Individual Newsletters
A single newsletter with a low open rate proves nothing. A downward trend over six newsletters proves something is wrong. Look at your metrics as a moving average, not as individual scores. A newsletter sent during a snowstorm or a major sports event will underperform regardless of quality. The trend over four to six sends is the real signal.
What a Spike in Unsubscribes Tells You
An unsubscribe rate that doubles after a specific newsletter is a diagnostic signal. Go back and look at that newsletter. Was it longer than usual? Did it cover a controversial topic? Was the subject line misleading? Did you change the send day or time? The spike rarely happens for no reason. Identifying the cause prevents the same problem from recurring.
Using Open Rate to Test Subject Lines
Subject lines are the most testable element of a newsletter because they have a direct, measurable relationship to open rate. For four consecutive newsletters, use a specific subject line that names the most time-sensitive item in the newsletter. For the next four, use a question or curiosity-style subject. Compare the average open rates. The approach that performs better for your specific parent community is the approach worth continuing.
Using Click Rate to Test Content Placement
If you have a recurring call to action, such as a link to the school calendar or a permission slip form, test placing it near the top of the newsletter for a few sends and near the bottom for a few sends. Compare click rates. The position that gets more clicks is where it should live. This is not about manipulating your audience. It is about understanding how they read and meeting them there.
The One-Change Rule
Change one thing at a time when using data to improve your newsletter. If you simultaneously change the subject line, the send time, and the section structure, you cannot attribute any improvement or decline to a specific change. Make one deliberate adjustment, run it for three to four newsletters, then evaluate. This is slow, but it is the only approach that produces reliable learning rather than lucky guesses.
What Data Cannot Tell You
Newsletter data measures behavior, not quality. A newsletter that parents open and scan quickly has a good open rate but may be producing less value than a longer newsletter that gets forwarded to a parent who needed the information. A newsletter with low click rates might still be generating conversations between parents and children that are impossible to measure. Use data as one input alongside what you hear directly from families, not as the only signal of whether your newsletter is doing its job.
Get one newsletter idea every week.
Free. For teachers. No spam.
Frequently asked questions
What newsletter metrics should a school track?
The three most useful metrics for school newsletters are open rate, click rate, and unsubscribe rate. Open rate tells you whether families are reading at all. Click rate tells you whether they are taking action. Unsubscribe rate tells you whether something you are doing is pushing people away. Tracking these three over time gives you enough information to make meaningful improvements without drowning in data.
How do I know if my newsletter metrics are good or bad?
Compare against your own trend, not industry averages. A 35 percent open rate that is trending up is better than a 45 percent open rate trending down. What you are looking for is directional movement over four to six weeks. A spike in unsubscribes after a specific newsletter is a signal to investigate that newsletter. A consistent decline in open rate over a semester is a signal to reassess your subject line strategy and send frequency.
How do I use click rate data to improve newsletter content?
When a newsletter has an unexpectedly high click rate, note what was different: was the call-to-action language more specific, was the button placed higher in the newsletter, was the deadline more prominent? When click rates are consistently low, look at whether the primary action is easy to find and whether the button language is specific. Use what you observe to make one change at a time and measure the result.
What should I do if my newsletter open rate is declining?
Check these four things in order: subject line quality, send frequency, list hygiene, and send timing. Most declining open rates are caused by subject lines that became too generic over time, frequency that exceeds what parents want, a list that has accumulated too many cold or invalid addresses, or a send time that no longer aligns with when parents check email. Fix one thing at a time and give each change three to four sends before evaluating.
Does Daystage provide analytics for school newsletters?
Yes. Daystage shows open rates and click rates for each newsletter send, as well as aggregate trends over time. Teachers can see which newsletters performed best and use those as models for future content. The analytics are built into the platform dashboard so there is no separate tool to manage.

Adi Ackerman
Author
Adi Ackerman is a former classroom teacher and curriculum writer with 8 years in K-8 schools. She writes about school communication, parent engagement, and what actually works in real classrooms.
More for Guides
Ready to send your first newsletter?
3 newsletters free. No credit card. First one ready in under 5 minutes.
Get started free